Financial ratios are a useful tool for analyzing your company’s financial health and performance. By comparing financial metrics, financial ratios can help you see into your company’s liquidity, solvency, profitability and efficiency.
You can calculate many financial ratios based on data from your income statement and balance sheet. The different financial ratios gives you different perspective on your company’s health and performance. Here are some financial ratios:
Gross Profit Margin
This measures the profitability of your company’s products or services. Calculate this by dividing gross profit (Revenue minus the cost of goods sold or cost of service) by total revenue. Depending on your industry, a gross profit margin of 40% or higher is generally considered healthy.

Inventory Turnover
This measure the efficiency of your company to sell your inventory. Calculate this by dividing the cost of goods sold by the average inventory. A high inventory turnover ratio of 10 or higher indicates that you are efficiently selling your inventory.

Debt-to-Equity Ratio
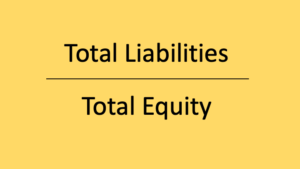
This measure the proportion of your company’s funds that comes from debt versus equity. This is calculated by dividing total liabilities by total equity. A debt-to-equity ratio of less than 1.0 is considered healthy since this means the debt is less than the company’s equity
Another type of financial ratios are liquidity ratios. These are financial metrics used to measure a company’s ability to pay off its short-term debts and obligations. These ratios are particularly important for small businesses as small businesses often have limited resources and may be more vulnerable to financial difficulties.
Keeping track of your liquidity ratios give you an insight to your numbers for you to make sure you don’t engage in activities that significantly disrupt your capability to manage your obligations. Here are some examples of liquidity ratios:
Current Ratio
This measures the company’s ability to pay short-term debts. Specifically, calculate this by dividing current assets such as your cash, inventory, and accounts receivables by your current liabilities such as accounts payables, taxes, and other short-term debts. A current ratio of anything higher than 1 is good but 1.5 or higher is generally considered healthy. This means that fora current ratio of 1.5 means that your current assets is worth 1.5 times more than your current liabilities

Cash Ratio
This ratio measures your company’s ability to pay off your short-term debt using only cash and cash equivalents. To do this, simply divide your company’s cash and cash equivalents by your current liabilities. A cash ratio of 0.5 or higher is generally considered healthy.

Daily Sales Outstanding (DSO)
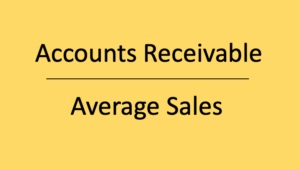
This ratio measures the average number of takes it takes for your company to collect payment from your customers after a sale. To calculate DSO, divide your accounts receivable in a period by total sales in the period divided by the days in the period. The resulting number is the average days it takes for you to collect payment from sales. The shorter the better.
In Summary
To get the numbers you would need to use from Oojeema, simply open your balance sheet and/or income statement reports. You may set the reports to show monthly, quarterly or annually. Just make sure you are using the numbers from the same period or range.

